
Sharpe Ratio - a measure of the Excess Return Earned Per Unit of Risk Taken
Sharpe Ratio = (Rp – Rf)/(Sp)
Where,
- Rp = Annualised Returns of the Portfolio (Average of the Portfolio’s Returns)
- Rf = Annualised Risk-Free rate of Return (Generally it indicates to 10yr Govt. bond yield rate)
- Sp = Annualised Risk associated with the Portfolio (Standard deviation of the Portfolio’s Returns)
The Sharpe Ratio measures risk-adjusted return by comparing an investment’s excess return to its risk. A higher ratio indicates better risk-adjusted performance.
- Sharpe Ratio > 3: A Sharpe ratio over 3 is considered exceptional and indicates outstanding performance. Investments with this ratio are likely taking on a very high level of return relative to risk.
- Sharpe Ratio > 2: A Sharpe ratio above 2 indicates excellent risk-adjusted performance. This level suggests that the investment is generating significant returns for the risk being taken, making it an attractive option for investors.
- Sharpe Ratio between 1 and 2: This range is considered good. It implies that the investment is providing a favourable return in relation to its risk, with 1.5 often seen as a benchmark for a strong investment.
- Sharpe Ratio = 1: A Sharpe ratio of 1 signifies that the investment’s return is equal to the risk taken. This level is often considered a reasonable reward for the level of risk.
- Sharpe Ratio < 1: This indicates that the investment is offering a return that is less relative to its risk. It suggests that the investment may not be worth the risk taken.
The potential appreciation of a portfolio over a specific time period depends on factors such as annualised returns, associated risk, and market conditions. In the context of equity investments, significant capital appreciation or capital loss are possible outcomes, each associated with varying probability levels.
The illustrations below will help clarify the impact of portfolio parameters on the likelihood of achieving specific levels of capital appreciation over different investment periods.
Illustration 1: Portfolio with Poor Risk-adjusted Returns

Illustration 2: Portfolio with Moderate Risk-adjusted Returns
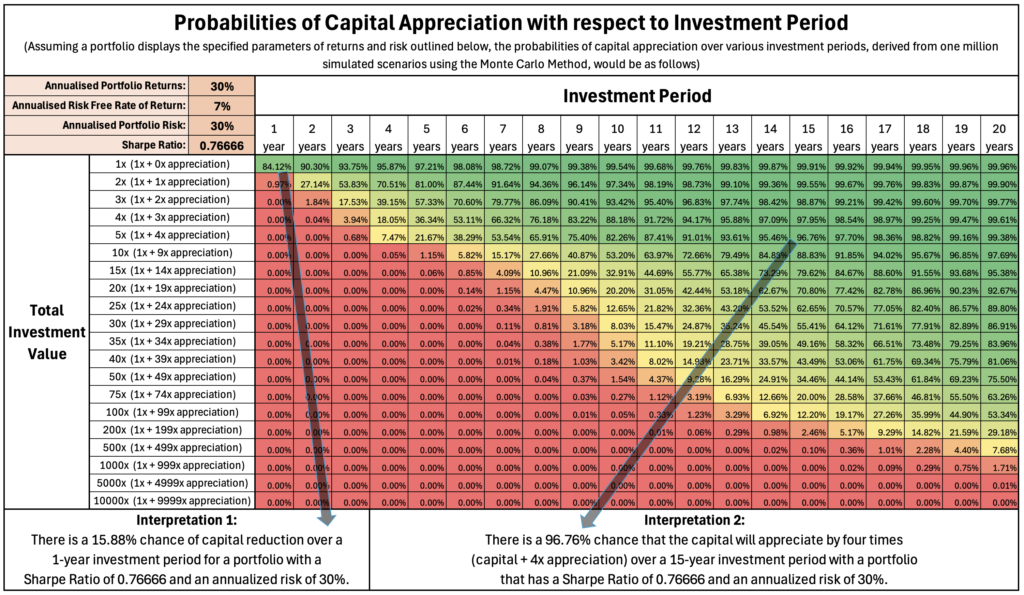
Illustration 3: Portfolio with Good Risk-adjusted Returns
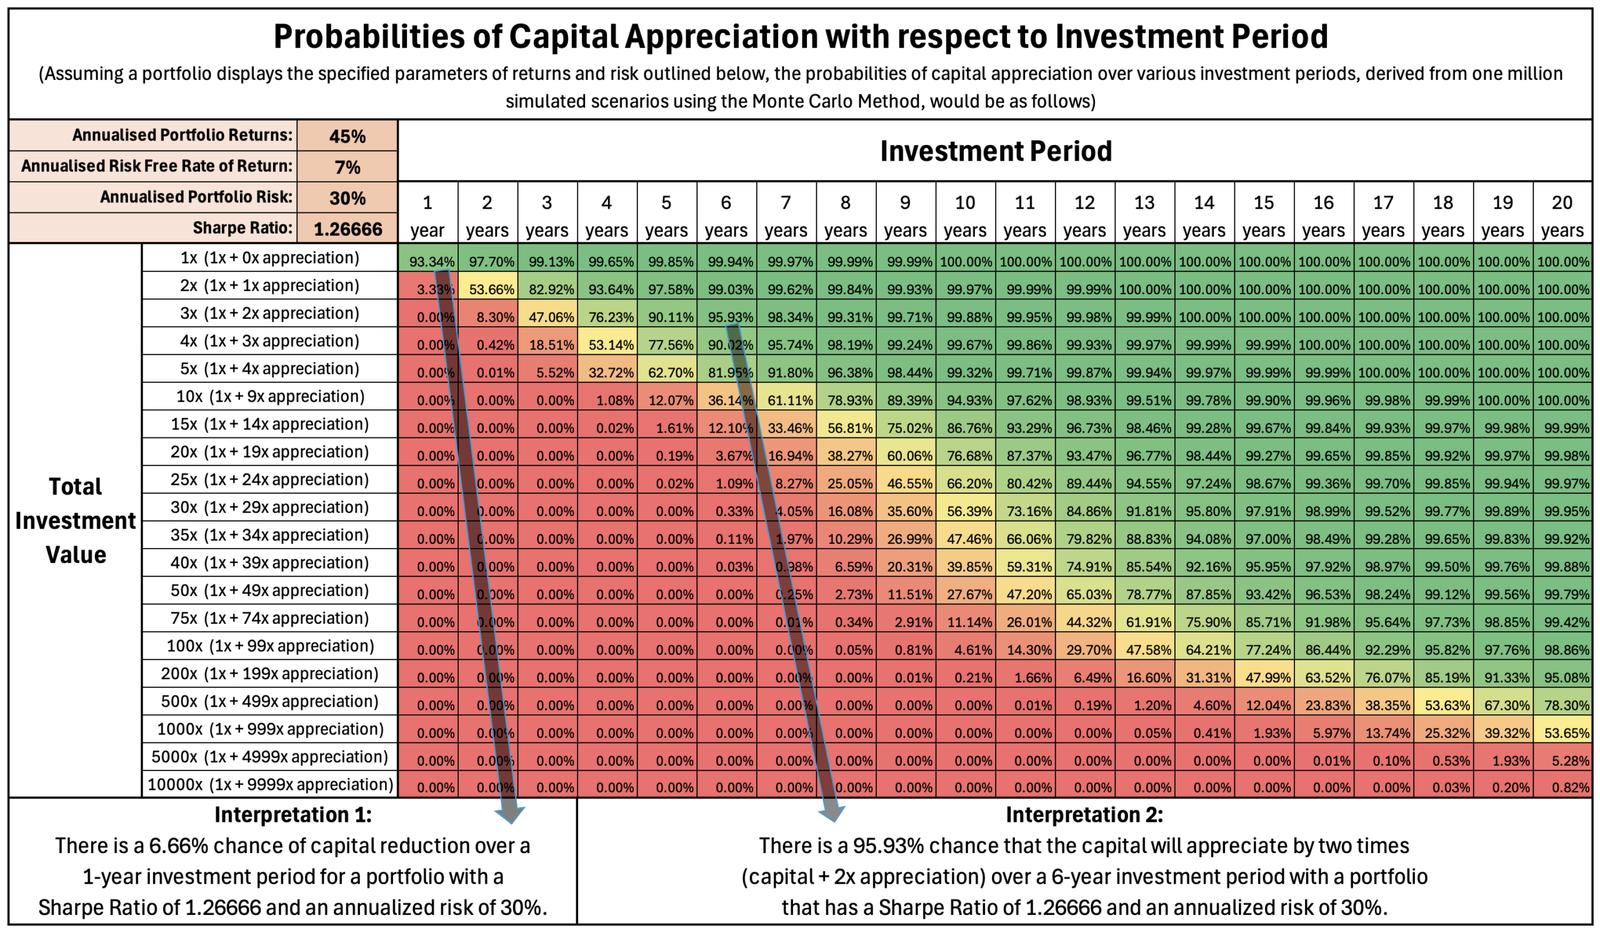
Illustration 4: Portfolio with Very Good Risk-adjusted Returns

Illustration 5: Portfolio with Exceptional Risk-adjusted Returns

These illustrations do not predict future market conditions or scenarios. They feature hypothetical portfolio parameter values for returns and risk and are intended solely for educational purposes. They do not correspond to any specific model portfolio subscription plan, nor do these parameters guarantee performance for any of the model portfolios I offer for subscription.
Key Learnings from the Illustrations:
- With a portfolio that yields poor returns relative to its associated risks, the probability of capital loss remains significant and cannot be ignored, even over longer investment periods, while the prospect of capital appreciation is also minimal.
- In the short term, the probabilities of losing capital are significant, even with a portfolio that can generate favourable returns relative to its associated risk.
- Portfolios capable of delivering better risk-adjusted returns enhance the probabilities of capital appreciation over the long term.
- With longer investment tenures, the likelihood of attaining higher levels of capital appreciation increases.